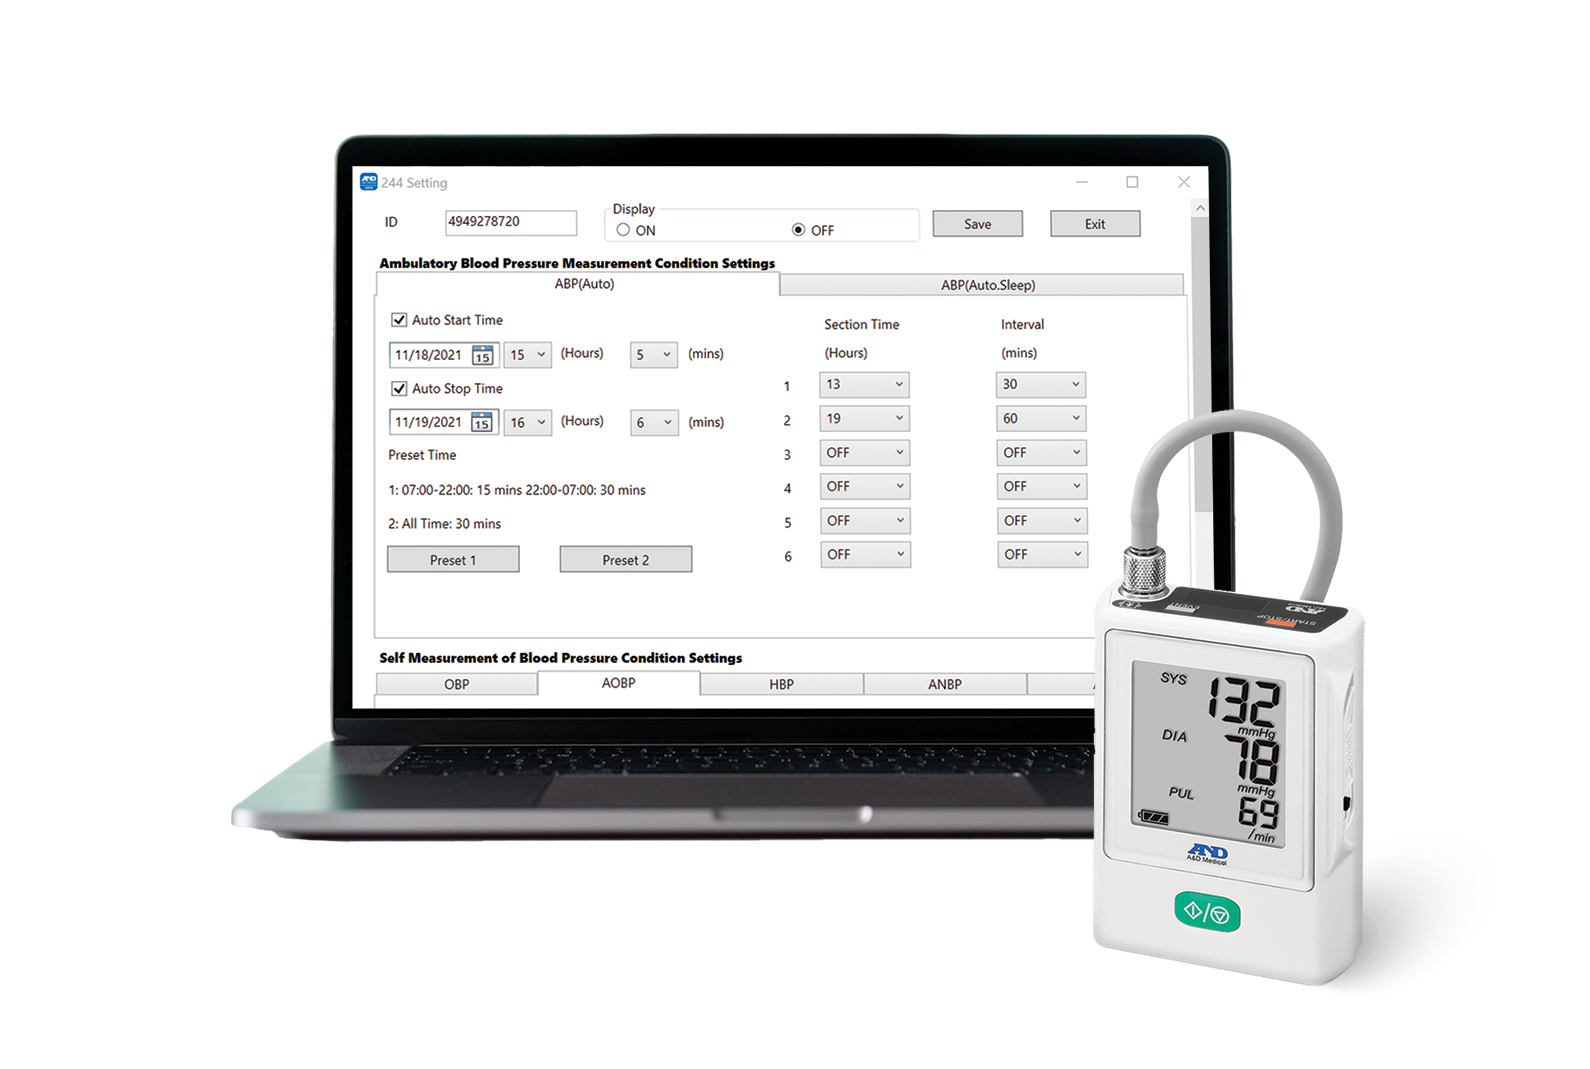
ABPM
Data Manager Software
An easy-to-use software platform to track, trend, and report the data generated by A&D Medical’s Ambulatory Blood Pressure Monitors.
- Quickly create new patients
- Customizable graphical analysis to meet the needs of your practice
- PDF reports can be printed or attached to an electronic health record (EHR)
For healthcare providers who need to monitor their patients’ blood pressure 24 hours a day, A&D Medical’s ABPM devices and Ambulatory Analysis Software records blood pressure as an oscillometric waveform. With our new analysis software, you can check the waveform record for each measurement to verify the accuracy of measured values.
The TM-2441 can also analyze environmental data collected by the multi-sensor technology, such as temperature, air pressure, activity, and acceleration, which can be essential components of determining hypertension vs. activity that impacts blood pressure, such as exercise or seasonal changes. This data can be combined with blood pressure measurements to produce graphs that help you understand fluctuations in BP readings.
Graphical Analysis
Maximize the value of different views of data points or adjust for your viewing preferences with histograms, trend analysis, correlation plots, and pie graphs.
Oscillometric Wave
Verify the accuracy of a given measurement with second by second waveform.
Circadian Rhythm Analysis
Automatically calculates increases or decreases of BP during sleep.
Morning Surge Analysis
Automatically calculates the mean BP during the first two hours after awakening.
Interested in Learning More?
Contact us to find out more about how ABPM can help streamline your practice, or read more in our Professional Resources section:


